← All product work

Turning a genetic report into a plan people can follow.

3X4 Health is the consumer app for the 3X4 Genetics DNA test. As the sole product designer, I took a dense, practitioner-grade report and designed an app that shows people what matters most in their results and what to do about it.

Role
Sole product designer
Team
Product owner, science team and in-house engineers
Platforms
iOS and Android
Timeline
Launched 2025, with the Genes First Plan and daily steps in later releases
My scope
Research, information architecture, user flows, wireframes, prototypes, visual design
Status
Live, with regular releases
Download as a 15-slide deck (PDF)
3X4 Health home screen with a daily Steps to Success card and the Genes First Plan of 12 actions. Genes First Plan overview with three pillars: what to eat, your daily stack and how to live.
Home and the Genes First Plan, from the current app.

The problem

The Blueprint report held real scientific value, but it was built for practitioners. Customers needed a way to understand it and use it day to day.

What I did

I worked with the science and product teams, who turned the report into plain language, and designed an app that starts with your top priority and lets you zoom in for detail.

What shipped

A live iOS and Android app that moves people from their cells to one clear action. The Genes First Plan has since replaced the first Summary Plan, with one small step each day.

The science was strong. The format was hard to use.

3X4 Genetics tests how your genes affect the biochemical pathways in your cells. The Blueprint report covers 35 pathway insights across 10 health categories, down to individual gene results. More than 9,000 health practitioners use 3X4's science with their clients.

That depth is the product's strength, but it also made the report hard for customers to use on their own. A long report is easy to read once and hard to act on. People needed to know where to focus, what the science meant for them, and what to do this week.

  1. Keep the science intact

    Simplify the way results are shown, not the results themselves. Nothing could be dumbed down or overstated.

  2. Make it make sense alone

    A customer should understand their results without a practitioner sitting next to them.

  3. End with a next step

    Every result should lead to something the person can actually do.

Translating science into plain language.

Our product owner took the science and made it readable, working with the science team. Each pathway result got a plain meaning and a matching action. My job was to design around that three-part pattern, and it became the backbone of the app.

The science

Detoxification Very High

A pathway result, rated by how much support it needs.

What it means

“Your cells are inefficient at removing toxins, impacting your cellular function.”

What to do

“Take broccoli sprout extract (sulforaphane) daily to support detoxification.”

Copy taken from the live app's public screens.

Summary first. Detail when you want it.

I mapped the information architecture as levels of zoom. The app opens on your top priority, and each level gives you the option to go deeper, all the way down to individual genes.

Entry

Top priority

Your highest genetic impact, shown first on the home screen.

  • Highest impact
  • Your plan
Level 1

Cells

Where it all starts: the core pathways inside your cells.

  • Methylation
  • Inflammation
  • Detoxification
  • Oxidative stress
Level 2

Body systems

How those pathways show up in your organs and systems.

  • Brain
  • Heart and vascular
  • Hormones
  • Weight
Level 3

Sensitivities

Everyday things your genes make you more sensitive to.

  • Histamine
  • Salt
  • Caffeine
  • Gluten
  • Iron
Level 4

Full report

All 10 categories and individual gene results, for people who want everything.

  • 35 pathways
  • Gene results

Simpler More detail

Flows first, then prototypes, then people.

I mapped the end-to-end journey before any visual design, so the team could agree on the order of information while changes were cheap. It runs from ordering the kit and waiting for results to the part people come back to: their highest genetic impact, their plan, and their cells and body systems, with pathway and gene detail underneath.

I worked through those flows and the zoom levels in low-fidelity wireframes, then built clickable prototypes so the product owner, science team and engineers could walk the real journey and check the content in context. Then I handed off to the in-house engineers.

After launch, I worked with the product owner and the marketing team on research, including a customer survey. What customers told us shaped the next release: the Genes First Plan.

Four choices that shaped the app.

Open on your top priority, not the whole report.

Results lead with your highest genetic impact: each body area opens on its illustration, with its pathways ranked from Very High down. Everything else is one tap away.

Why: showing all 35 pathways with equal weight hides what matters. Ranking them tells people where to start.

Cellular results: an illustrated cell with its pathways, above Pathway Results led by Methylation, Very High.

Use the body as the map.

Pathways and sensitivities sit on an illustrated body, at the cell, organ or system they affect. People find their way by place, not by scientific name.

Why: most people know where their heart is. Few know what methylation means. The illustrated body works as an educational tool that feels familiar, and gives unfamiliar terms an anchor.

Sensitivities screen. Histamine overload, salt, iron overload, caffeine and gluten are placed around a body illustration.

One rating scale, in colour and in words.

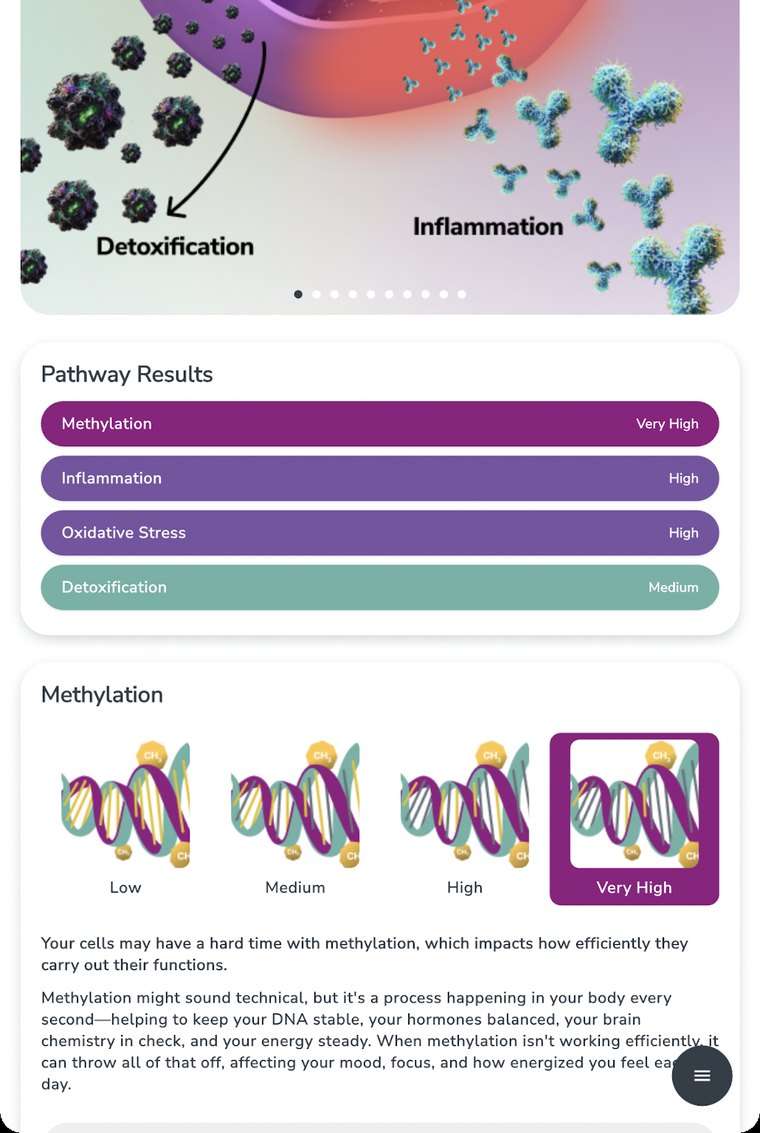
Every pathway result uses the same four-step scale, from Low to Very High. Each bar carries its rating as a word, so it never relies on colour alone, and each pathway shows the full scale so people can see where they sit.

Why: the scale comes from the Blueprint report, so the app speaks the same language as the report and the practitioners who use it. Learn it once and every result is comparable: follow the purple.

Pathway Results list rated from Medium to Very High, above a Methylation card that shows the four-step scale from Low to Very High as illustrations.

Every finding ends in an action.

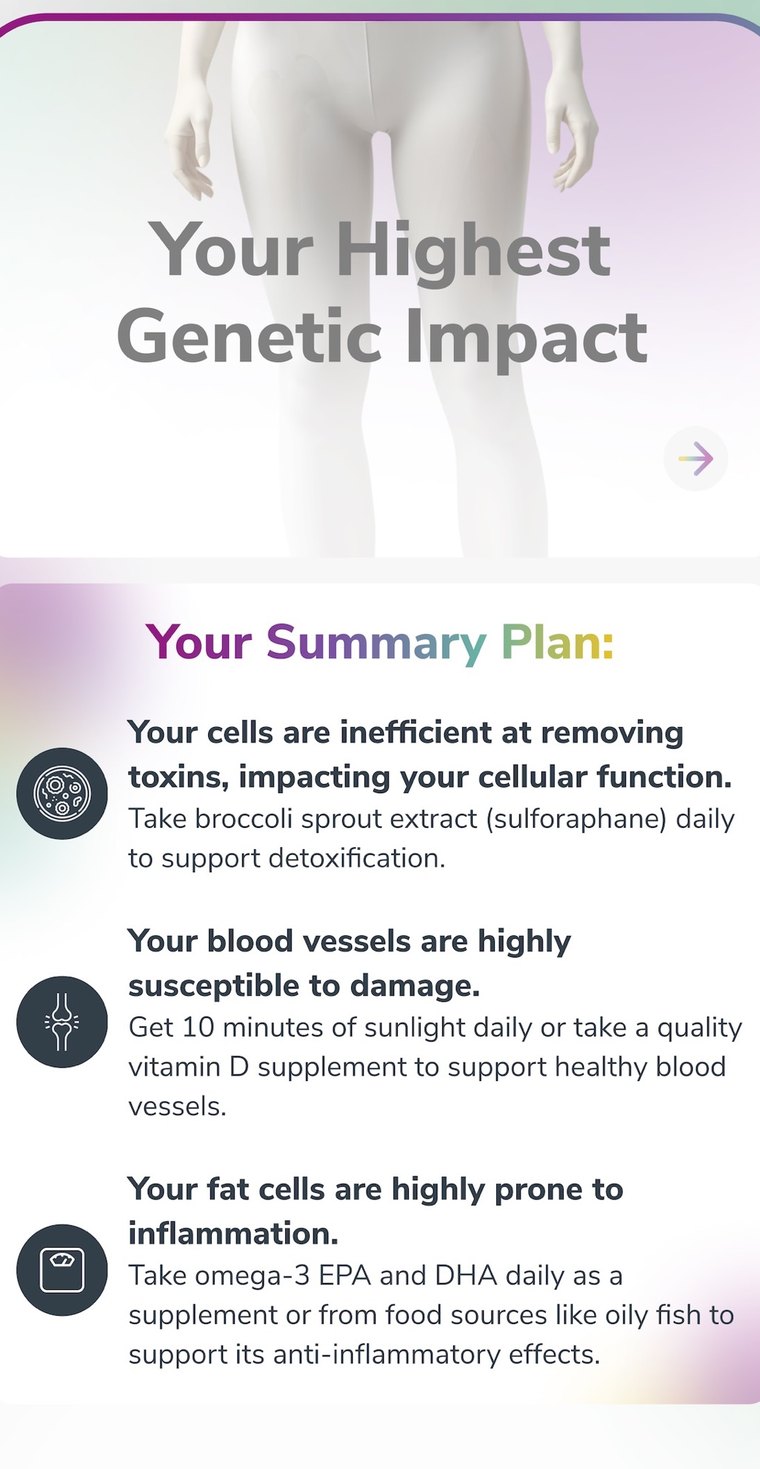
The first release’s Summary Plan paired each finding with one specific thing to do, using the same science, meaning and action pattern.

Why: understanding a result is only useful if it changes what you do. The plan is the reason to come back to the app.

Summary Plan with three findings about toxins, blood vessels and fat cells, each with a daily action.

Growing the plan: Genes First.

Shaped by the customer survey, the Genes First Plan later replaced the Summary Plan: a plan people could live with, on the same science, meaning and action pattern.

Diet, supplements and lifestyle, built from your genes.

The plan takes the person's highest-impact pathways and turns them into three pillars: what to eat, a daily supplement stack and how to live. Each pillar has three priorities and a Cellular Booster. It adapts to allergies, dietary restrictions and eating pattern, which people can change at any time.

Every action carries the same three parts: what to do, how often, and why it matters for your genetics.

Genes First Plan overview: three pillars, what to eat, your daily stack and how to live, each with priorities and a Cellular Booster.
What to eat list: marine omega-3s, prebiotic vegetables, leafy greens and eggs, each with a serving frequency.
Why this matters screen for marine omega-3s: what a serving looks like and why it is recommended.
Food preferences screen with allergies, dietary restrictions and eating patterns as selectable chips, and a Save and rebuild button.

One small step a day.

A plan only helps if people act on it. Steps to Success turns the plan into one small, concrete step each day, right at the top of the home screen.

Make the next action small and specific.

Each step is a single, doable thing, like a lunch idea built from three foods in the plan. It's tagged with the pathway it supports, and opens to a recipe idea and the reason behind it.

Why: "eat more omega-3s" is advice. "Buckwheat, beetroot and sunflower seeds at lunch" is something you can actually do.

Step detail: enjoy buckwheat, beetroot and sunflower seeds at lunch today, with a recipe idea, the reason it helps, and Complete or Do tomorrow buttons.

Give people an easy way out that isn't failure.

Every step has two choices: Complete, or Do tomorrow. Past steps stay visible, a level ring shows progress, and people can rate each recommendation.

Why: a missed day shouldn't feel like the end of the plan. Moving a step forward keeps people going, and ratings tell the team which recommendations land.

Steps to Success screen with a level ring, today's step with Complete and Do tomorrow buttons, and previous steps below.

A report people can keep.

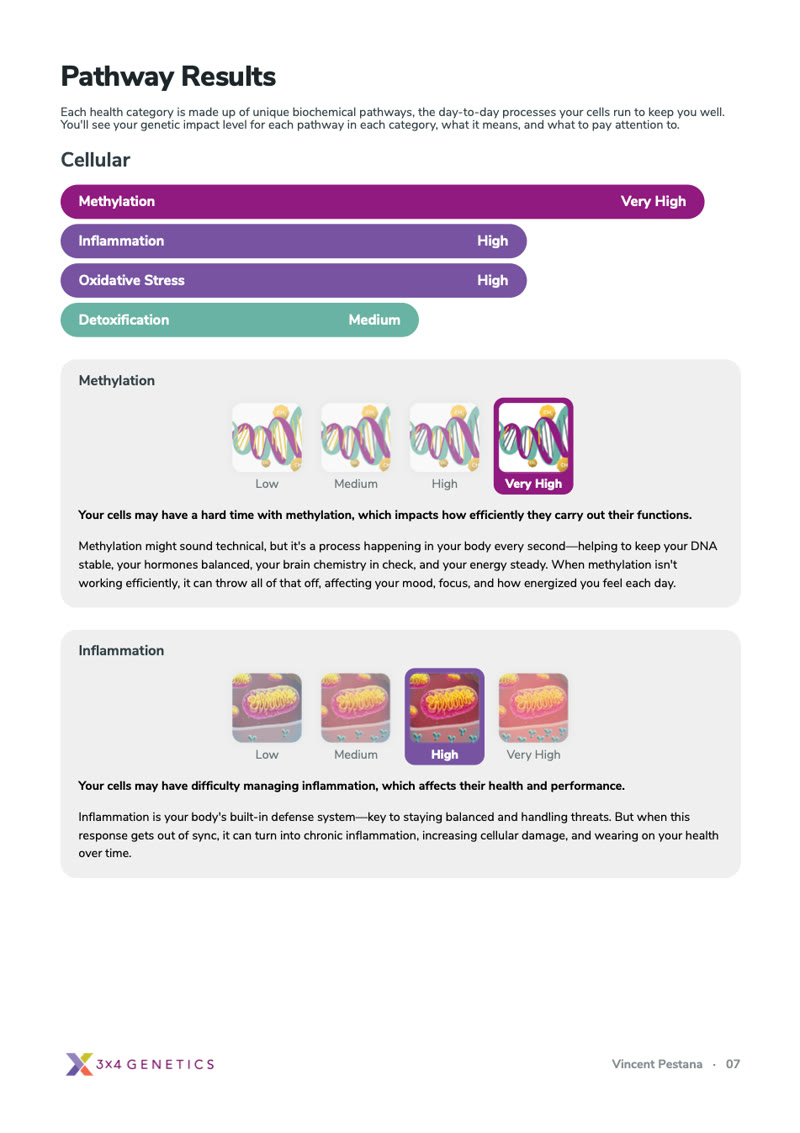
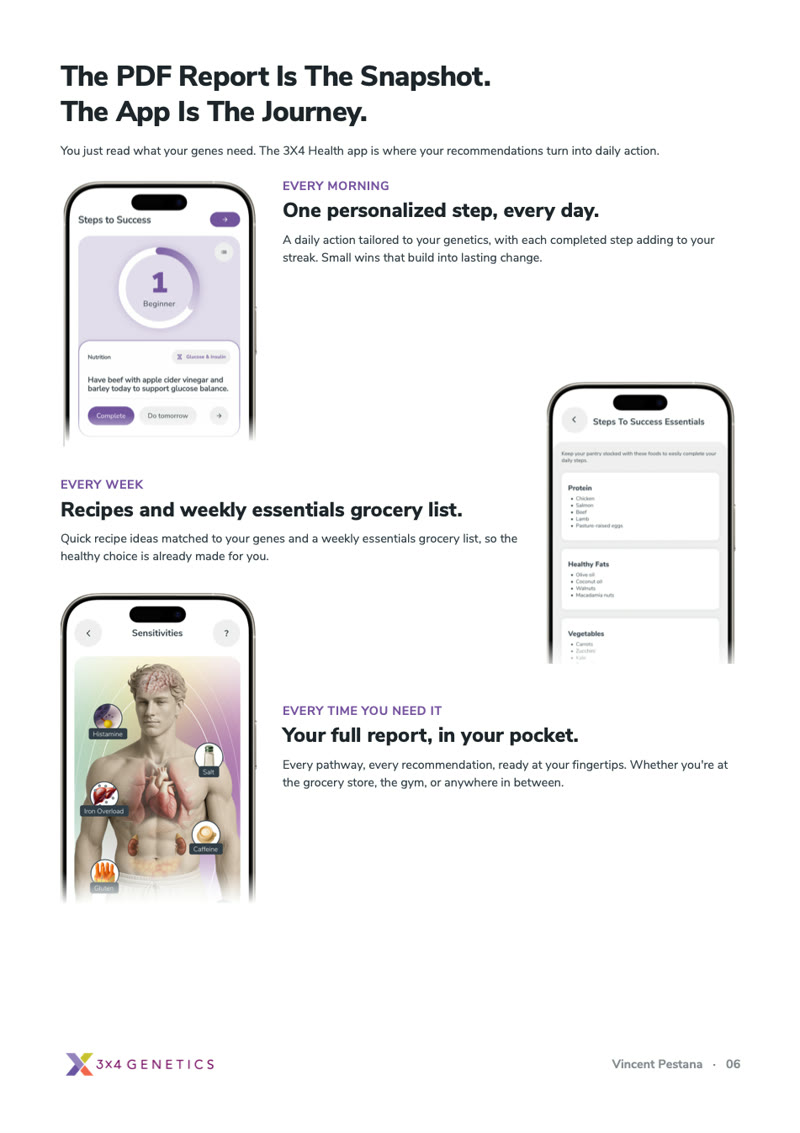
Customers asked for a copy of their results they could save and come back to. I designed the 3X4 Health Report, a PDF made from their results: a personal cover, how impact is rated, every pathway on the same purple scale, and a page that hands them back to the app.

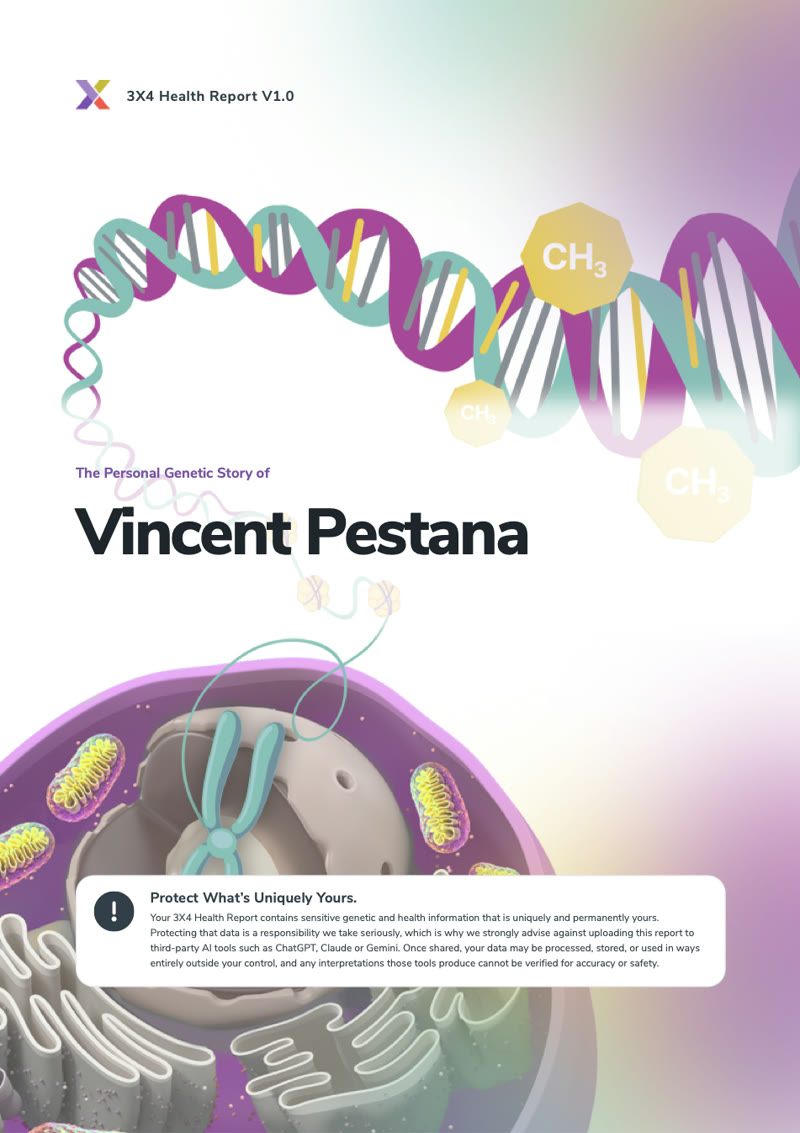
Report cover: The Personal Genetic Story of Vincent Pestana, over a DNA and cell illustration.
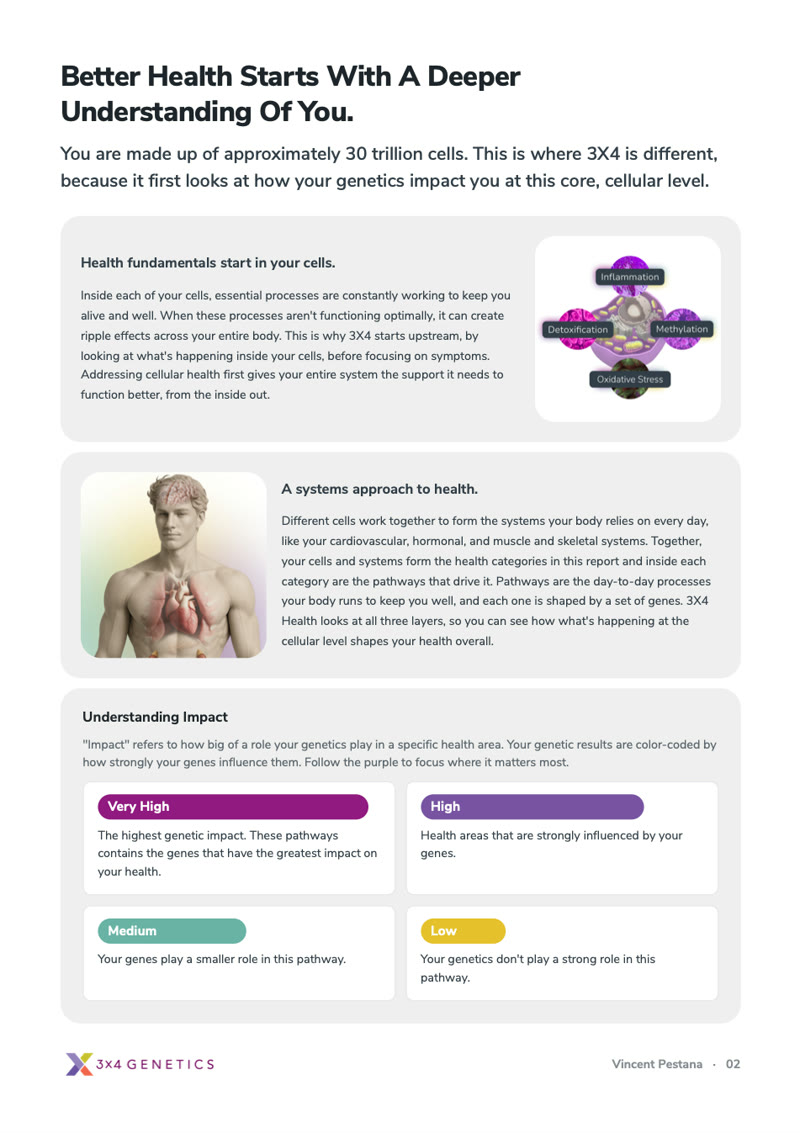
Introduction page: health starts in your cells, a systems approach, and how impact is rated from Low to Very High.
Pathway results page: cellular pathways rated on the purple scale, with methylation and inflammation explained.
Page titled The PDF report is the snapshot. The app is the journey, with daily steps, recipes and the full report in the app.

Pages from my own report. The gene-by-gene tables are left out.

What shipped, and what I learned.

iOS + AndroidLive on both stores since 2025
10 categories35 pathways, now readable in one app
3 pillarsDiet, supplements and lifestyle, plus one step a day

What I learned

  • Design follows the content pattern. The science, meaning and action pattern shaped the screens more than any layout choice, so I designed around it rather than around the report.
  • Ranking is a kindness. Choosing what to show first helps people more than showing everything at once.
  • Design for coming back. A report is read once. A plan gives people a reason to return.

What I would do next

  • Learn from "Do tomorrow". Look at which steps get pushed back most and make those easier, or offer alternatives.
  • Close the loop on ratings. Show people how their feedback changes the steps they get.
  • Bring practitioners in. Let a person share their plan with their practitioner from inside the app.

Company work is described at a high level to protect internal data, customer privacy and the wider team's contributions. I don't share internal usage figures, so this case study shows what shipped rather than claiming uplift. Screens come from the public App Store listing and the live app, with personal results such as gene variants left out.

Want to talk about this work?

I'm happy to walk through the flows, decisions and trade-offs in more detail.